Download Oracle.1z0-1041-20.PremDumps.2021-01-28.72q.tqb
| Vendor: | Oracle |
| Exam Code: | 1z0-1041-20 |
| Exam Name: | Oracle Cloud Platform Enterprise Analytics 2020 Specialist |
| Date: | Jan 28, 2021 |
| File Size: | 290 KB |
| Downloads: | 1 |
Demo Questions
Question 1
You want to create a filter that restricts access to the Fact table so that Revenue is only visible to users assigned to a particular role.
In which tab should you set this up?
- Permissions
- Row Level Data
- Table Filter
- Data Filters
Correct answer: D
Explanation:
Reference: https://docs.oracle.com/en/cloud/paas/bi-cloud/bilpd/securing-access-data.html Reference: https://docs.oracle.com/en/cloud/paas/bi-cloud/bilpd/securing-access-data.html
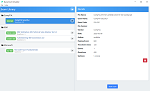
Question 2
Oracle Analytics Cloud offers several visualization options for presenting query results. How do you explicitly invoke “best visualization” in Oracle Analytics Cloud?
- Select the desired data elements from the Data Elements pane and drag them onto the Best Visualization zone in the Explore pane.
- Drag an entire Data Set from the Data Elements pane onto the Data Visualization canvas and let the tool determine the best visualization.
- Select the “Best Visualization” option from the project’s Canvas Settings drop-down menu.
- Select the desired data elements from the Data Elements pane, right-click and select “Create Best Visualization” from the drop-down menu.
Correct answer: D
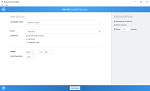
Question 3
Which two statements are true regarding configuring filters to control visual content? (Choose two.)
- Expression filters cannot be applied in the filter steps of Oracle Analytics Cloud Data Visualization data flows.
- Variables may be employed in all Data Visualization filter types (that is, Range, List, Date, Expression).
- Application role filters for fact and dimension tables are defined in the Oracle Analytics Cloud Data Modeler.
- When the Oracle Business Intelligence Enterprise Edition repository is used as a data source, filters defined in the initialization blocks with the client administration tool are automatically inherited in Data Visualization.
Correct answer: CD