Download Microsoft.DA-100.NewDumps.2021-03-15.89q.tqb
| Vendor: | Microsoft |
| Exam Code: | DA-100 |
| Exam Name: | Analyzing Data with Microsoft Power BI |
| Date: | Mar 15, 2021 |
| File Size: | 9 MB |
Demo Questions
Question 1
You have a table that contains sales data and approximately 1,000 rows. You need to identify outliers in the table. Which type of visualization should you use?
- area chart
- donut chart
- scatter plot
- pie chart
Correct answer: C
Question 2
You have a Microsoft Power BI data model that contains three tables named Orders, Date, and City. There is a one-to-many relationship between Date and Orders and between City and Orders. The model contains two row-level security (RLS) roles named Role1 and Role2. Role1 contains the following filter.
City[State Province] = "Kentucky"
Role2 contains the following filter.
Date[Calendar Year] = 2020
If a user is a member of both Role1 and Role2, what data will they see in a report that uses the model?
- The user will see data for which the State Province value is Kentucky and the Calendar Year is 2020.
- The user will see data for which the State Province value is Kentucky or the Calendar Year is 2020.
- The user will see only data for which the State Province value is Kentucky.
- The user will receive an error and will not be able to see the data in the report.
Correct answer: B
Explanation:
When a report user is assigned to multiple roles, RLS filters become additive. It means report users can see table rows that represent the union of those filters. Reference:https://docs.microsoft.com/en-us/power-bi/guidance/rls-guidance When a report user is assigned to multiple roles, RLS filters become additive. It means report users can see table rows that represent the union of those filters.
Reference:
https://docs.microsoft.com/en-us/power-bi/guidance/rls-guidance
Question 3
You are creating a quick measure as shown in the following exhibit.
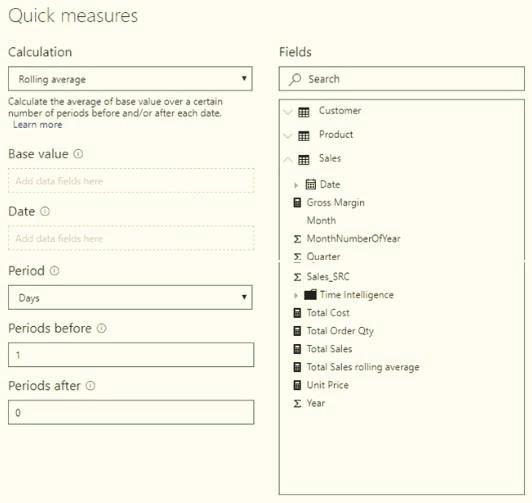
You need to create a monthly rolling average measure for Sales over time-How should you configure the quick measure calculation? To answer, select the appropriate options in the answer area.
NOTE: Each correct selection is worth one point.
Correct answer: To work with this question, an Exam Simulator is required.
Explanation:
Box 1: Total SalesWe select the field Total Sales Box 2: DateSelect a date field. Box 3: MonthMonthly periods. Reference:https://docs.microsoft.com/en-us/power-bi/transform-model/desktop-quick-measures Box 1: Total Sales
We select the field Total Sales
Box 2: Date
Select a date field.
Box 3: Month
Monthly periods.
Reference:
https://docs.microsoft.com/en-us/power-bi/transform-model/desktop-quick-measures