Download Microsoft.70-779.ActualTests.2019-09-15.46q.tqb
| Vendor: | Microsoft |
| Exam Code: | 70-779 |
| Exam Name: | Analyzing and Visualizing Data with Microsoft Excel |
| Date: | Sep 15, 2019 |
| File Size: | 3 MB |
Demo Questions
Question 1
Note: This question is part of a series of questions that present the same scenario. Each question in the series contains a unique solution that might meet the stated goals. Some question sets might have more than one correct solution, while others might not have a correct solution.
After you answer a question in this section, you will NOT be able to return to it. As a result, these questions will not appear in the review screen.
You have a Power Pivot model that contains the following tables.
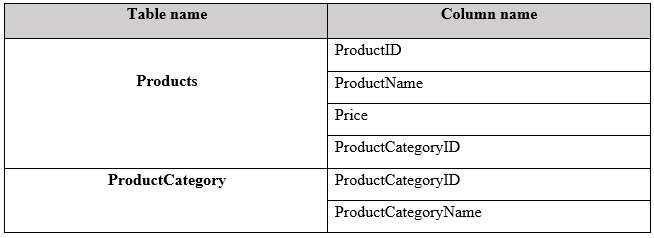
There is a relationship between Products and ProductCategory.
You need to create a hierarchy in Products that contains ProductCategoryName and ProductName.
Solution: You create a calculated column that uses the RELATED DAX function
Does this meet the goal?
- Yes
- No
Correct answer: A
Explanation:
References:https://www.mssqltips.com/sqlservertip/2900/creating-hierarchies-in-powerpivot-for-excel/https://msdn.microsoft.com/en-us/library/ee634202.aspx References:
https://www.mssqltips.com/sqlservertip/2900/creating-hierarchies-in-powerpivot-for-excel/
https://msdn.microsoft.com/en-us/library/ee634202.aspx
Question 2
Note: This question is part of a series of questions that present the same scenario. Each question in the series contains a unique solution that might meet the stated goals. Some question sets might have more than one correct solution, while others might not have a correct solution.
After you answer a question in this section, you will NOT be able to return to it. As a result, these questions will not appear in the review screen.
You have a Power Pivot model that contains the following tables.
There is a relationship between Products and ProductCategory.
You need to create a hierarchy in Products that contains ProductCategoryName and ProductName.
Solution: You create a measure that uses the ISCROSSFILTERED DAX function
Does this meet the goal?
- Yes
- No
Correct answer: B
Question 3
Note: This question is part of a series of questions that use the same scenario. For your convenience, the scenario is repeated in each question. Each question presents a different goal and answer choices, but the text of the scenario is the same in each question in this series.
Start of repeated scenario.
You have six workbook queries that each extracts a table from a Microsoft Azure SQL database. The tables are loaded to the data model, but the data is not loaded to any worksheets. The data model is shown in the Data Model exhibit. (Click the Exhibit button.)
Exhibit:
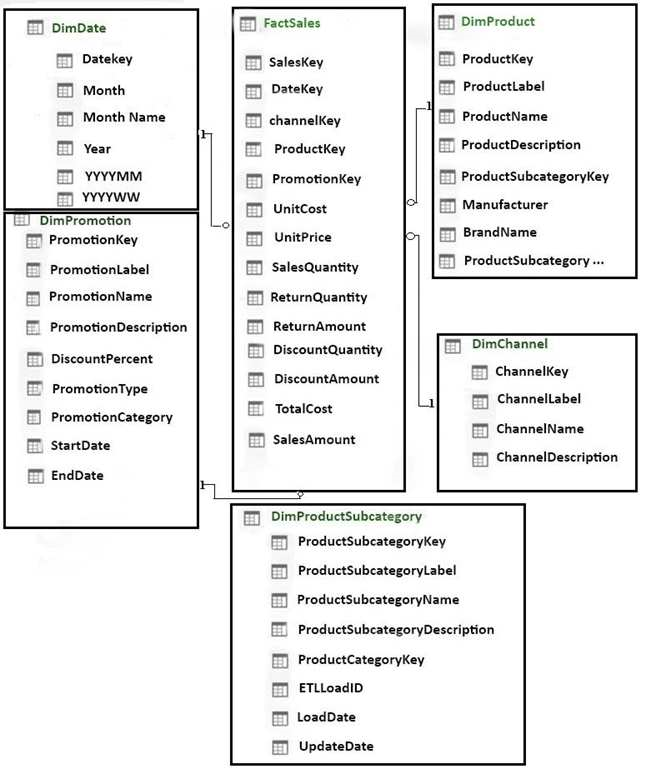
Your company has 100 product subcategories and more than 10,000 products.
End of repeated scenario.
You need to create a simplified view of the workbook for some users. The simplified view must only display data from FactSales, DimProduct, and DimDate.
What should you do in the data model?
- Click Hide from Client Tools for all the tables except FactSales, DimProduct, and DimDate
- Add the columns from FactSales, DimProduct, and DimDate to the Default Field Set
- Create a new perspective
- Modify the Table behavior settings for FactSales, DimProduct, and DimDate
Correct answer: A
Explanation:
References: https://support.office.com/en-us/article/hide-columns-and-tables-in-power-pivot-ddf5b1f2-2ed2-4bdb-8f78-6f94503ca87a References: https://support.office.com/en-us/article/hide-columns-and-tables-in-power-pivot-ddf5b1f2-2ed2-4bdb-8f78-6f94503ca87a